Canvas Syllabus Tracker uses Canvas API to access all the active courses with student enrollments. This platform allows user to filter results by semester and department. The users can also view all the courses per department and compare side by side using the Google Charts. The data is represented using the visual analytics. Each course title is then populated below. If there is any content present on the syllabus tab on canvas course or contains a syllabus file, link title is generated which will redirect to the syllabus content.
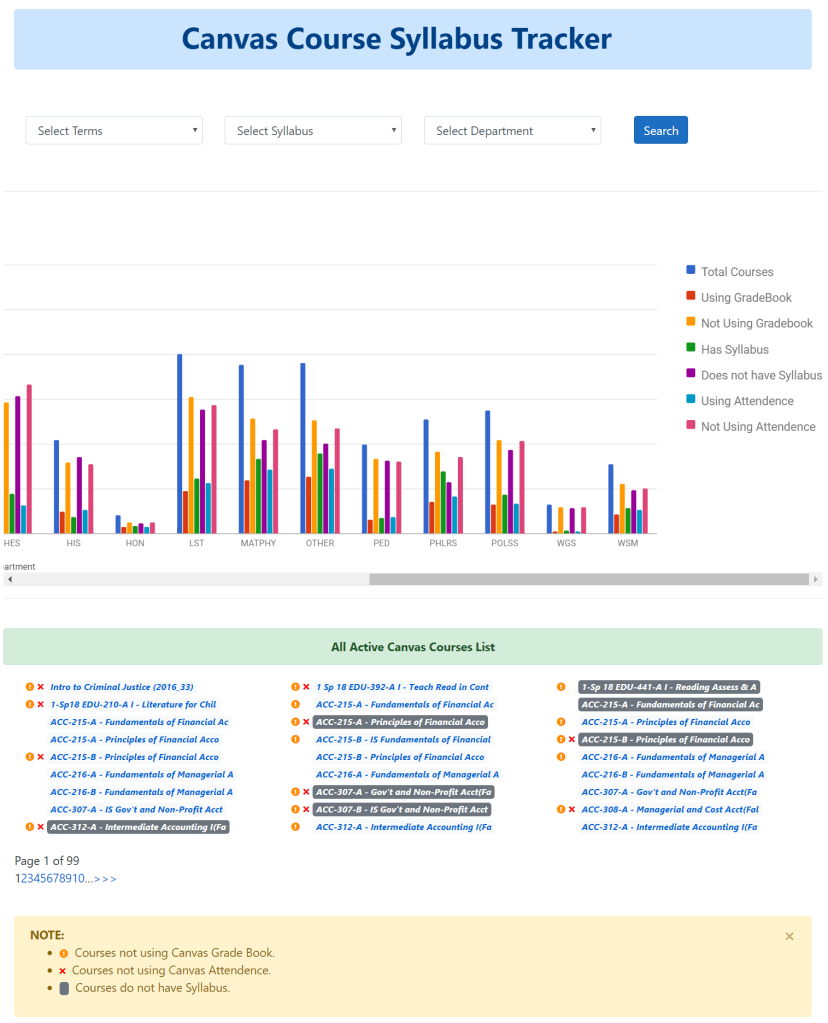
- Filter Results: Provides the result for the entire college comparing each department side-by-side. Allows user to filter the result by semester and/or department.
- Visual Analytics: Google Charts are used to create visual analytics showing the courses with syllabus versus without syllabus, courses using grade book verses not using grade book and courses using builtin attendance versus not using attendance.
- Course Tile and Syllabus Link: The course title for all the active courses are loaded. If the course contains a syllabus file or has syllabus page, the course title will become hyperlink that will directly access the course file or syllabus. If the course contains both, then the syllabus file is prioritized.
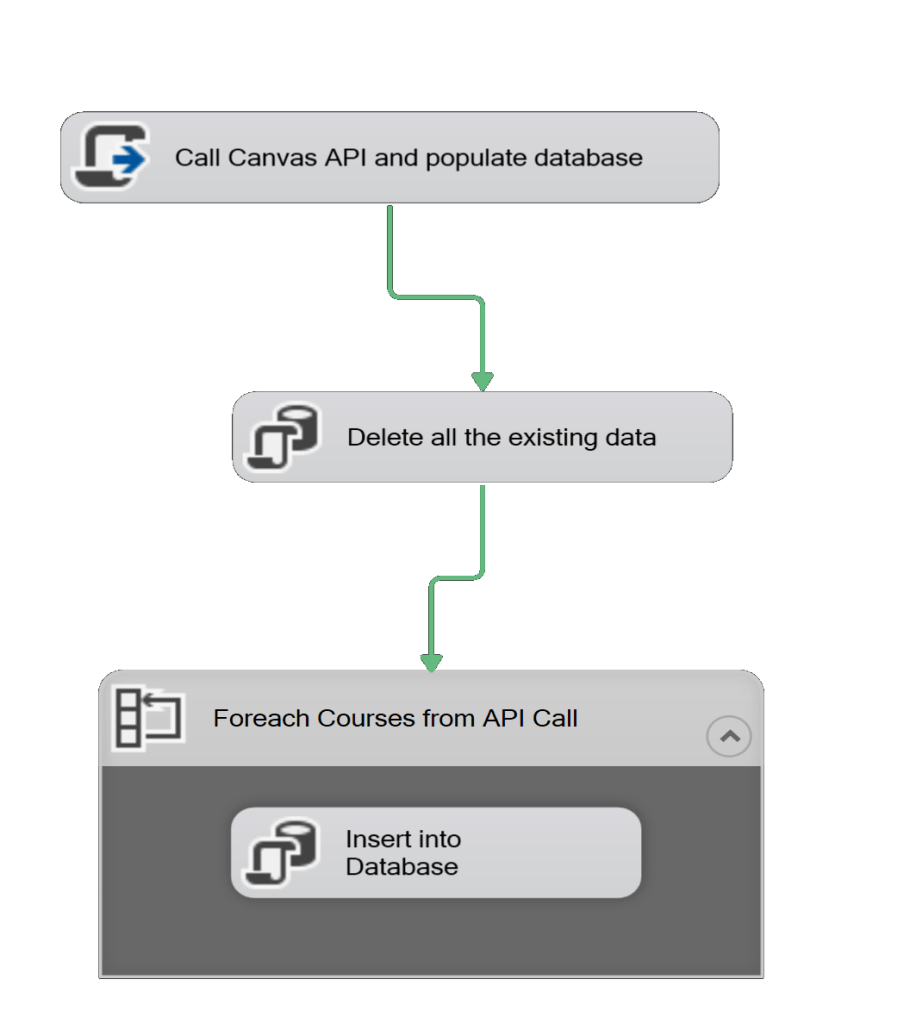
This project uses the Microsoft Integration Services (SSIS) that uses the REST API to get data in order to merge the data from the api calls and populate the database. This tool is implemented in this project in order to minimize the data loading time as loading of millions data rows and then processing them could take a long time. The script task uses API Calls to get data from Canvas and then is inserted into the database that is used to generate the Syllabus Tracker Dashboard.